STOCKS
The global stock markets returned -1.3% in the first quarter of 2025.
The United States stock market returned -5.17% in the first quarter of 2025.
Value vs. Growth
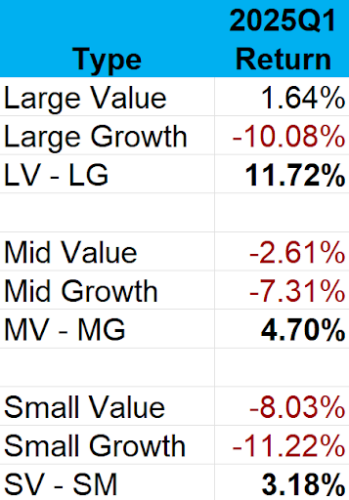
The chart below is the ratio of value stocks to growth stocks.
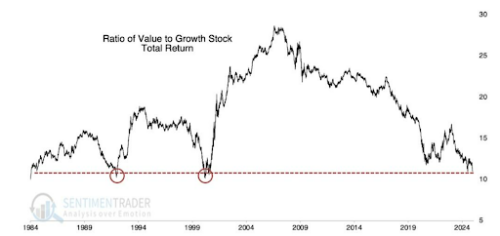
As you can see, over the last 40 years, every time the ratio has been at the current level, value stocks have outperformed growth stocks in a rather dramatic fashion for years.
The double bottom in 2000 looks similar to the double bottom in 2024.
The reward/risk ratio for owning value stocks versus growth stocks is very high.
Assuming a 50/50 weighing, our Stock and ETF models’ combined average has a 10.23% earnings yield. That isn’t something you see very often for an American-based asset management firm.
Our Models are 62% Value, 31% Blend, and 7% Growth.
International vs. U.S.
The real belle of the ball in the 1st quarter was international stocks.
The United States stock market lost 5.17% but Developed and Emerging Markets ex-US were up 5.66%.
***
Compared to United States’ stocks, European stocks are very cheap as you can see by the chart below.
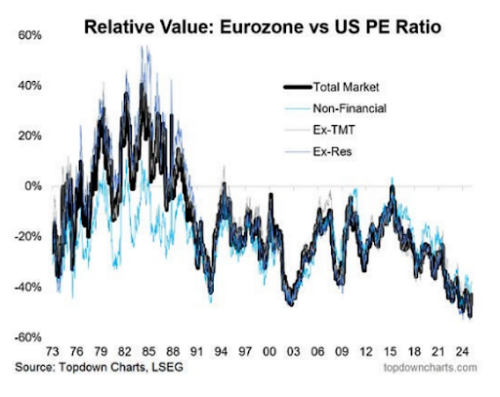
Near the end of 2024, the ratio was at the bottom of a half-century range.
The reward/risk ratio looks high for European stocks.
***
As for Emerging markets, here is a chart of Emerging Markets vs. the World Markets going back to 1988:

The Emerging Markets/World Markets ratio is near the lower end of its 37-year range.
In all past instances the ratio was this low in the chart, it has been a superb buying opportunity.
Emerging markets stocks have a higher earnings yield than developed markets. As for the other half of the equation…growth…emerging markets are growing faster than developed ones.
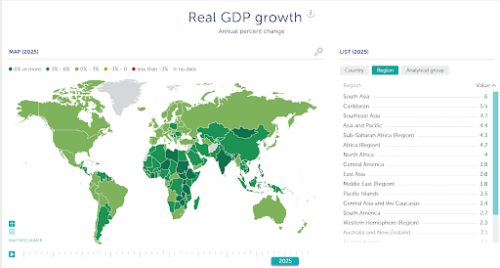
And here is the rest of the table:

In summary, emerging markets have both a higher earnings yield AND better growth than developed markets.
Our models are 68% invested in United States stocks and 32% International stocks.
Small Caps vs. Big Caps
While there have been signs of a major reversal in International Value stocks, it remained business as usual for big cap outperformance over small cap stocks.
Big caps (S&P 500) returned -4.59% while small caps (Russell 2000 index) returned
-9.79%
Small caps currently are less than 4% of the U.S. stock market.
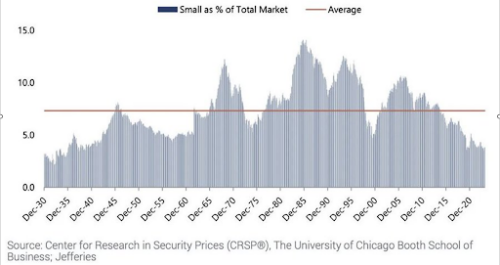
As you can see, small cap stocks as a percentage of the stock market are trading at 1930’s levels.
Our models are 30% large, 49% mid and 21% small.
Stock Market Correction
The stock market has had its second correction of the bull market. We have seen some real extremes in investors’ pessimism.
For example, the SPY put volume reached the 3rd highest in history.
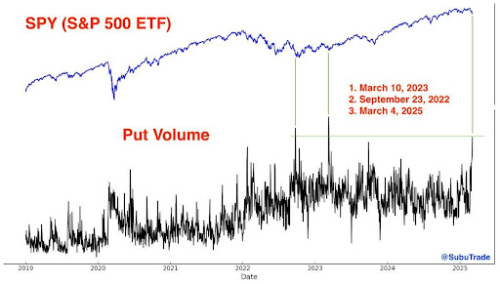
As you can see, when there is a mad rush to buy protection from a crash, it has been a good time to buy stocks.
The four-week average of the AAII Bull/Bear ratio (Bulls + 0.5 Neutral) recently hit the 3rd lowest reading in history out of 1,956 weeks.
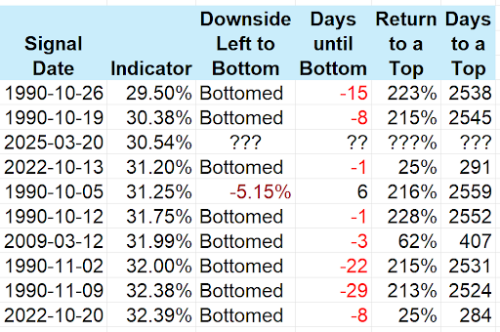
When people are not bullish, it has been a fantastic time to buy stocks.
CREDIT
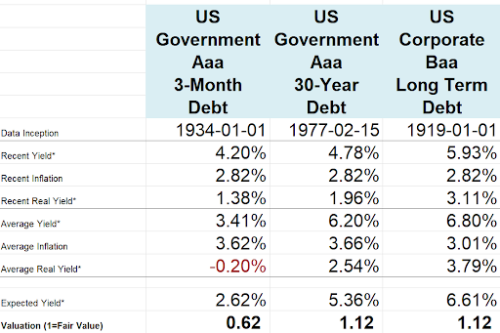
What this table is suggesting is that 3-Month T-Bills is one of the very few undervalued areas in the U.S. financial markets today.
30-Year bonds and Long-Term investment grade corporate bonds are moderately overvalued.
Many people seem to feel that tariffs will cause inflation. However, financial market participants are expecting the inflation rate over the next 30 years to be 2.25%.
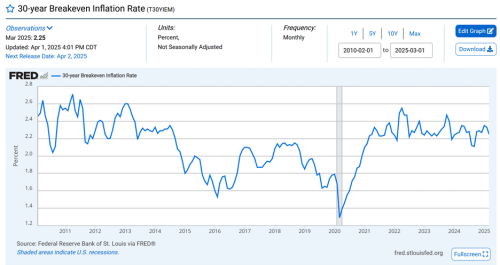
The most noteworthy news coming out of the international markets was the Chinese 10-year bond yield tumbled to about 1.60%. That is the lowest in history.
REAL ESTATE
There is a lot of gloom and doom with respect to the media coverage of the real estate as well.
But there is a certain amount of truth to what the financial pundits are saying. The cap rate (income/price) for U.S. real estate is 4.8%. That is considerably lower than its 7.58% historical average.
We believe the best indicator for future real estate prices is the futures market. The real estate futures market did a spectacular job in predicting the Great Financial Crisis real estate crash. The futures market also correctly predicted the moderate pullback that happened in real estate a couple of years ago.
What is the futures market saying now?
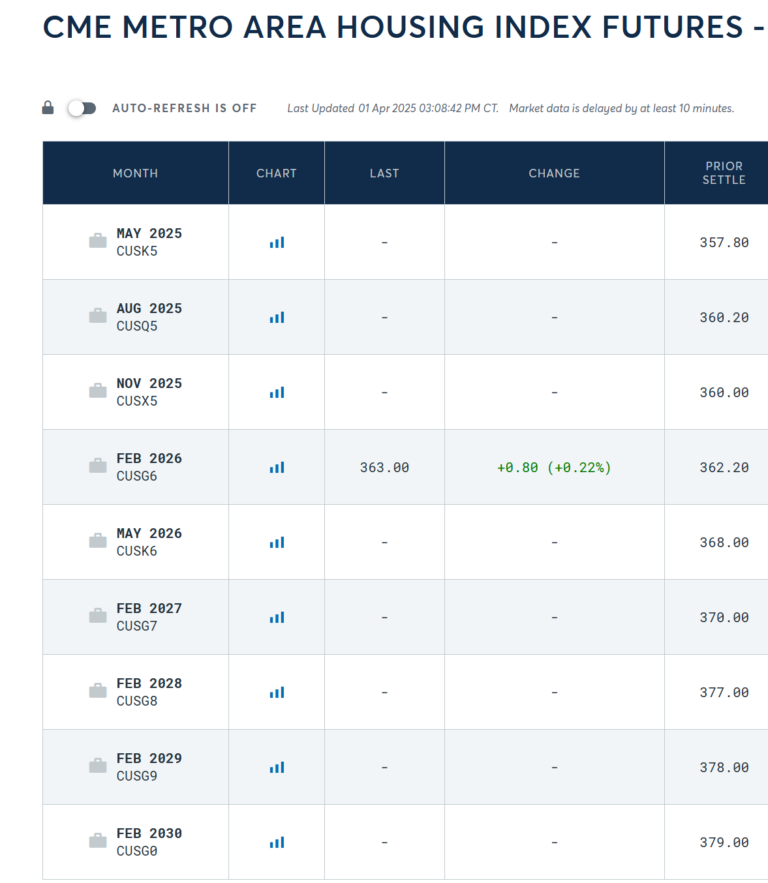
The Futures market is calling for a 1.21% annualized return in real estate over the next 4.75 years.
This provides us with a nice transition into our last asset class-commodities.
COMMODITIES
Here is a chart of gold to real estate:

This is an interesting chart because both real estate and gold are expensive by a wide variety of metrics.
You can compare real estate (cap rate) to bonds (dividend yield) and stocks (earnings yield) easily because all three have a yield of some sort.
But commodities don’t have a yield.
Therefore, it can be a bit tricky to value commodities. The above chart is a solid attempt.
The gold/housing chart gave a similar warning back in 2011 in what proved to be a top for gold and a pretty good time to buy real estate.
Since real estate is pricey now, that seems even more ominous for gold.
***
We have been writing about oil and oil stocks for a while now. Oil is still down over half from its all-time high…16 years later.
But despite this, oil stocks ended the quarter not far from an all-time highs:

We are overweight energy stocks.

